

Quantitative Data Analysis Services
Data plays an important role in academic research, business studies, and scientific investigations. Researchers collect information to understand different problems, identify patterns, and make meaningful conclusions. However, collecting data is only one part of the research process. Understanding and analyzing that information is equally important.
Quantitative Data Analysis Services help researchers understand numerical information through statistical methods and analytical techniques. These methods allow students and researchers to organize data, examine relationships, compare results, and present findings in a clear format.
Whether a research project involves surveys, questionnaires, experiments, or numerical records, proper data analysis helps turn collected information into meaningful results.
What Is Quantitative Data Analysis Service?
Quantitative data analysis is the process of examining numerical information using mathematical and statistical techniques. It helps researchers understand data patterns, measure differences, and identify relationships between variables.
For example, a student conducting research about online learning may collect questionnaire responses from 200 students. The collected information can be analyzed to understand student satisfaction, study habits, and learning preferences.
Researchers use different statistical techniques depending on their research questions and the type of data they collect.
Quantitative analysis is commonly used in education, healthcare, business, psychology, economics, and social sciences.
Importance of Statistical Data Analysis in Research
Statistical data analysis is an important part of research because it helps researchers understand numerical findings more accurately.
Without proper analysis, collected information may be difficult to interpret or compare.
1. Helps Understand Research Findings
Statistical techniques allow researchers to organize numerical information and identify important patterns. They can examine survey responses, compare groups, and understand changes in collected data.
2. Supports Better Research Decisions
Research findings can provide useful information for academic and professional decisions. Statistical analysis helps researchers evaluate evidence rather than relying only on assumptions.
3. Identifies Relationships Between Variables
Researchers often investigate whether two or more variables are related. For example, a study may examine the relationship between study hours and academic performance.
Statistical methods help researchers examine these relationships and interpret the results carefully.
4. Improves Research Presentation
Tables, charts, graphs, and statistical summaries make research findings easier to understand. Proper presentation also helps readers follow the results of a study.
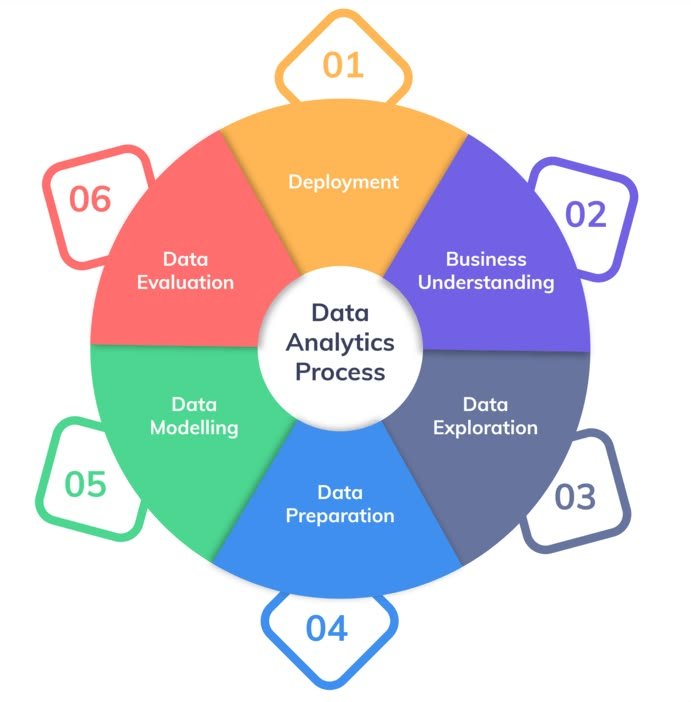
Common Quantitative Research Methods
Researchers use different methods to collect and examine numerical information. The choice of method depends on the research objectives, questions, and available data.
Descriptive Statistics
Descriptive statistics summarize the main characteristics of a dataset. They help researchers understand the overall distribution and structure of collected information.
Common descriptive statistical measures include:
- Mean
- Median
- Mode
- Standard deviation
- Frequency
- Percentage
- Minimum and maximum values
For example, a researcher may calculate the average age of survey participants or the percentage of students who prefer online learning.
Inferential Statistics
Inferential statistics help researchers use sample information to draw conclusions about a larger population.
These techniques are commonly used when researchers cannot collect information from every member of a population.
Examples include hypothesis testing, confidence intervals, and statistical significance testing.
Correlation Analysis
Correlation analysis examines the relationship between two numerical variables.
For example, researchers may investigate whether study time is associated with examination scores.
Correlation results help identify the direction and strength of an association. However, correlation alone does not establish that one variable causes changes in another.
Regression Analysis
Regression analysis examines how one or more independent variables are associated with a dependent variable.
It is commonly used in business, education, economics, and social science research.
For example, a researcher may examine how study hours, attendance, and learning resources are associated with students’ academic performance.
T-Test and ANOVA
T-tests and Analysis of Variance (ANOVA) are statistical methods used to compare group differences.
A t-test is commonly used to compare the means of two groups, while ANOVA can compare the means of three or more groups under suitable conditions.
Researchers should select the appropriate method according to their data and research design.
SPSS Data Analysis Services for Academic Research
SPSS is a statistical software program commonly used in academic and professional research. It helps researchers organize datasets, perform statistical calculations, and generate tables and charts.
Students working with survey data often use SPSS to examine questionnaire responses and prepare research findings.
Data Entry and Data Cleaning
Before conducting statistical analysis, researchers need to prepare their datasets.
This process may involve checking missing values, identifying duplicate records, correcting data entry errors, and organizing variables.
Clean and properly structured data can help reduce errors during analysis.
Frequency and Descriptive Analysis
SPSS can generate frequency tables, percentages, averages, and other descriptive statistics.
These results help researchers understand the characteristics of their participants and summarize collected information.
Hypothesis Testing
Hypothesis testing allows researchers to examine specific assumptions about their data.
Depending on the research question, suitable statistical tests can help determine whether the observed results provide sufficient evidence against a proposed null hypothesis.
Tables and Graphical Presentation
SPSS can produce different tables, charts, and statistical summaries.
These outputs help researchers present findings in a structured and understandable way.
Statistical Analysis for Research: A Step-by-Step Process
A systematic approach helps researchers complete data analysis more effectively. Each stage should be connected to the research objectives and questions.
Step 1: Understand the Research Objectives
The first step is to understand what the research aims to investigate.
Researchers should identify their research questions, objectives, and hypotheses before selecting statistical methods.
Step 2: Collect Relevant Data
Data may be collected through questionnaires, surveys, experiments, or existing datasets.
The collection method should match the research design and target population.
Step 3: Prepare and Organize the Dataset
Collected information should be checked and organized before analysis.
Researchers should review variable names, data types, missing information, and possible inconsistencies.
Step 4: Select Suitable Statistical Techniques
The selection of statistical techniques depends on the type of data and research questions.
For example, descriptive statistics may be appropriate for summarizing survey responses, while regression analysis may be suitable for examining relationships between variables.
Step 5: Analyze and Interpret Results
After performing statistical tests, researchers need to understand what the results mean.
Statistical values should be explained in relation to the research objectives rather than presented without context.
Step 6: Prepare the Final Research Report
The final stage involves presenting findings through tables, charts, explanations, and appropriate academic language.
Researchers should ensure that their results are accurate, understandable, and consistent with their research methodology.
Data Interpretation Services and Their Benefits
Data interpretation is the process of explaining what statistical results mean in relation to a research question.
Numerical results alone do not always explain the importance of a study. Researchers need to connect their findings with the research objectives and existing knowledge.
Clear Understanding of Results
Proper interpretation helps researchers understand the meaning of statistical outputs and identify important findings.
Better Research Discussions
Interpreted findings can support the discussion chapter by connecting research results with previous studies and relevant theories.
Accurate Academic Reporting
Researchers should explain statistical results carefully and avoid making conclusions that are not supported by their data.
Improved Research Communication
Clear explanations, organized tables, and suitable charts make findings easier for readers to understand.
Common Mistakes in Quantitative Data Analysis
Researchers should be careful when preparing and analyzing numerical information. Some common mistakes can affect the accuracy and quality of research findings.
Choosing the Wrong Statistical Test
Every statistical test has specific requirements. Researchers should select methods according to their research questions, variable types, and data characteristics.
Ignoring Missing Data
Missing information can affect statistical results. Researchers should examine missing values and select an appropriate method for handling them.
Misinterpreting Statistical Results
A statistically significant result does not automatically mean that an effect is large or practically important.
Researchers should consider the research context, effect size, and limitations of their analysis.
Poor Data Presentation
Unclear tables and charts can make findings difficult to understand. Research results should be presented with meaningful titles, labels, and explanations.
Quantitative Data Analysis at EliteContentWriter
At EliteContentWriter, students and researchers can explore academic writing and research-related support for their educational projects.
Our academic services cover areas such as research proposals, academic editing, thesis-related guidance, and data analysis.
We understand that research involves more than collecting information. Students also need to organize their findings, understand statistical outputs, and present their work according to academic requirements.
Our aim is to help students improve their understanding of research methods, develop clearer academic documents, and communicate their findings effectively.
Students should remain involved in their research process and understand the methods and results presented in their academic work.
Frequently Asked Questions
What are quantitative data analysis services?
These services involve examining numerical information using statistical techniques to identify patterns, compare variables, and understand research findings.
Which software is used for quantitative data analysis?
Common software includes SPSS, R, Microsoft Excel, SAS, and Stata. The selection depends on the research requirements and type of analysis.
What is the difference between quantitative and qualitative data analysis?
Quantitative analysis focuses on numerical information and statistical methods, while qualitative analysis examines non-numerical information such as interviews, opinions, and experiences.
Is SPSS suitable for student research?
Yes. SPSS is commonly used in academic research for descriptive statistics, hypothesis testing, correlation, regression, and other statistical procedures.
Why is data interpretation important?
Data interpretation helps researchers explain the meaning of statistical results and connect their findings with research objectives.
Conclusion
Quantitative research requires careful planning, accurate data preparation, appropriate statistical techniques, and meaningful interpretation. Researchers need to understand each stage to ensure that their findings are presented clearly and correctly.
Quantitative Data Analysis Services provide an opportunity for students and researchers to understand numerical information, examine statistical results, and improve their academic research skills.
By selecting suitable research methods, preparing clean datasets, and interpreting findings carefully, researchers can develop more organized and meaningful academic studies.